ASP.NET provides async actions starting with .NET 4.5. Nowadays asynchronism is a trendy subject which nobody could just ignore or resist to adapt. In this blog, we will try to dig what it brings to the table and how it compares with the good old synchronous approach we have happily used for years. Instead of giving only the assertions, we will create sample programs and observe the behaviour while it is happening. This approach will hopefully help us understand how ASP.NET processes the requests when it comes to the thread management. There is no big difference between handling of MVC and Web API actions, for ease of demonstration we will use Web API here. Almost evertyhing stated and demonstrated for Web API will be valid for MVC too.
Work Summary
In the blog, we will try to compare and contrast async and sync actions from various aspects in the use cases.
- We will first introduce async actions by comparing the behaviour of async and sync actions.
- We will then cite the use cases and discuss where async actions just fit better and where sync actions shine.
- We will finally create some programs to prove the assertions and also learn how ASP.NET processes the requests.
Prerequisites
In order to follow this blog and the given samples easily, you need to be familiar with Docker Compose, Make and JMeter a bit. Being able to run docker-compose, running Make and JMeter will be enough. Even if you do not know Docker Compose, Make and JMeter or just do not want to use them or do not want to follow along, you can trust what is written and tried here and still benefit from it :)
Async vs Sync Actions
Introduction
In order to better understand async actions, we first need to talk about the behaviour of ASP.NET sync actions. When ASP.NET receives a request, it allocates an available thread in the thread pool to fulfill it. The thread is occupied by the request until a response becomes ready and is sent to the caller. The thread used in this process can not be used anyhow for any other requests. This architecture therefore limits the number of concurrent requests to the number of threads in the thread pool. If on average your ASP.NET processes a request in 200 milliseconds (hence 5 requests per second) and there are 10 worker threads (let us pretend that we have limited the number of threads to 10), your pipeline’s throughput will be 50 requests per second. If this is not enough for your application’s needs, then you might think that you could just increase the number of threads in the thread pool. If you increase it to 100 let us say, you throughput will be 500 requests per second. When you increase it further to 1000 threads your throughput will be 5000 requests per second. This last number may fulfill your needs but as you might have guessed, it is not that simple. If that was it, then there would be no need to write this blog and write the sample applications below. We will elaborate on this from different angles throughout the blog.
I/O Bound and CPU Bound Applications
Async actions come into play to be able to share ASP.NET worker threads between different requests. It is very very common that throughout the lifecycle of a web request, the ASP.NET worker thread makes a call to an external resource like a database or another web service and just wait for the result to fulfill what has been requested from her. As stated above, the ASP.NET threads are just kept blocked when sync actions are used. Async actions on the other hand allows the worker threads to be shared across actions while the worker threads are waiting for a response from an external resource (waiting I/O). So async innovation allows ASP.NET worker threads to do some other productive work while they are waiting for an external resource. With this assertion in mind, we can say that the throughput achieved in our app could be massively improved if our app is an I/O bound app.
Giving an example will help us understand better. In the example above, we assumed 200 milliseconds processing time for a request. Let us say that the thread is consuming 50 milliseconds while processing the requests internally and 150 milliseconds externally (while making I/O). In sync case, a thread could process 5 requests per second. In async case however 150 milliseconds of the time the thread could be used for other requests and therefore a thread could handle 20 (1000 milliseconds / 50 milliseconds) requests per second. So 10 worker threads will be able to process 200 requests per second instead of 50. As a second example, let us pretend that our application is CPU bound and consuming 180 milliseconds while processing the requests internally and 20 milliseconds for making I/O. In this case, each thread could handle 1000 / 180 = 5.55 requests per second and 10 worker threads will be able to process 55.5 requests per second instead of 50, which is a 10% improvement which might not worth the burden of asynchronism.
So what is suggested above is that I/O bound applications will benefit from performance and scalability greatly when async actions are used. CPU bound applications however will not benefit from async conversion in ASP.NET actions. We will try to prove this assertion in the next sections by demo applications.
Simplicity of Application
Asynchronism comes with some complexity. Although it is not in the scope of this blog, ASP.NET implementation requires understanding of async, await concepts along with Task library. Making the action asynchronous only will not be enough. The utility methods called from the action will also need to honour the async principles. If the thread executing the action is blocked by a method in the stacktrace, then the thread will not be able to be shared across. As you might have guessed, a truely async app development requires a lot of effort which is not the case for sync case.
Use Cases Where Async or Sync Actions Would Fit Better
Reading through the previous section, it must be easy to follow this one.
CPU Bound applications
Applications like calculating an optimization algorithm, processing a big file in the memory are dependent usually use the CPU when scheduled, therefore there is no point here in using asynchronous actions because the thread will not be blocked by I/O. Making these type of applications async will cause more overhead then delivering any benefit therefore these should be better written with sync actions.
I/O Bound applications
An application like a proxy web service making simple filtering, validation and passing the request to a backend service usually sits and waits for the result from the backend service therefore using asynchronous actions will greately improve the overall throughput. It is highly unlikely to write a load balancer in any language than C or C++ but if written, it would also be written with async actions because a load balancer just forwards the requests to the next available server and waits for the response.
Cancellable applications
It might be the case that your action requires cancellation. Pretend an application where you make 10 different requests concurrently and wait for the results, you pick the result from the first comer, you are not interested in the results of the remaining 9 therefore need cancelling in order not to use system resources. This case requires async actions because they could be cancelled after fired.
Low throughput applications
Some applications just do not get many concurrent requests by nature because there are not many users using it. Back office applications might be a good example. When there are not many requests around to be fulfilled, there might be no need to bother with async actions and just go with sync actions. So this case be better implemented using sync actions but they could equally be written with async actions whichever suitable would be OK.
Sample Program
The sample program demonstrating the behaviours described above is a ASP.NET Web API project built on top of OWIN infrastructure and running on Mono. Web API has a single controller named Customers which have both sync and async actions which we will use for demos.
The sample app is dockerized so that you can run, follow the steps and see the results yourself. You can change the source code and see its effects if you want. Please find the source below.
Setting Up the Test Environment
In order to run the app, clone the repository, open a terminal window and navigate to Docker folder. Run make app command in order to build the application and have it running. For every test, we will restart the app and we will use make restart-app command for that. In the terminal window, you will see logs dumping the number of currently used threads, available worker threads and available IOCP port threads. We will use these to comment on the results.
To test the application, we will use JMeter, please download JMeter 3.0.
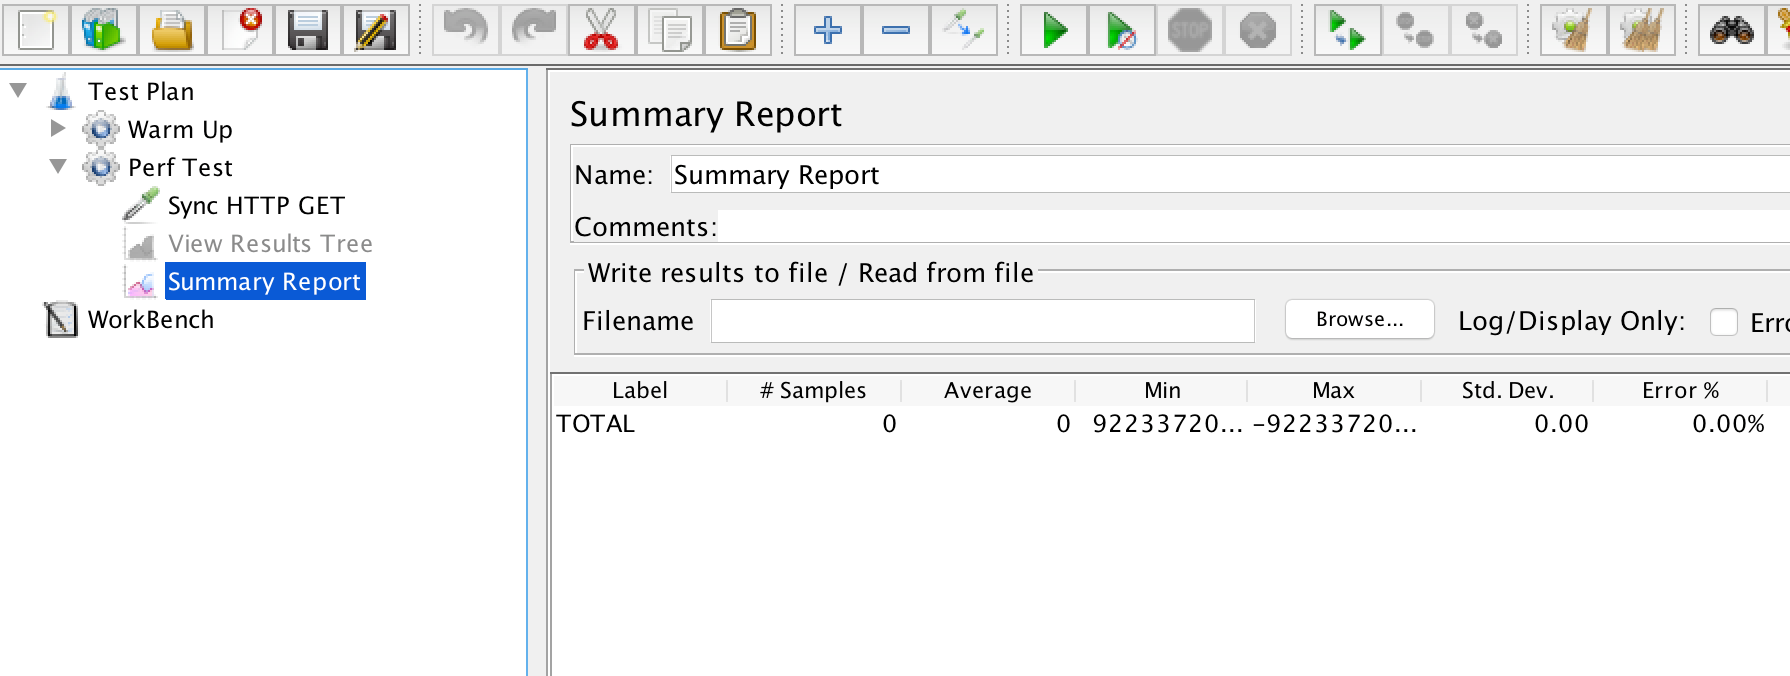
For each test, expand the thread group and locate Summary Report listener like below to see the test progress.
Sync / Async Comparison in I/O Bound Application
Customers controller has SyncGet200MsDelay and AsyncGet200MsDelay actions which are just sleeping for 200 milliseconds and returning a list of customer. One is doing it synchronously and one is asynchronously. The sleep period is there to simulate a database or an external web service call.
Sync action test
[HttpGet]
public IHttpActionResult SyncGet200MsDelay()
{
    // simulate a delay - could be a database query or another service request
    Task.Delay(200).Wait();

    return Ok(GetSampleCustomers());
}
Let us first test the sync action in the I/O bound case namely, SyncGet200MsDelay action. JMeter thread group will give 50 concurrent requests and all will make 5 loops. What is acceptable is that every request to be returned within 200+ milliseconds because the action will be making them wait at least for 200 milliseconds, if we count a few more milliseconds for processing, we expect requests to take around 200-210 milliseconds.
Run make restart-app command, run JMeter and open the file JMeter/Sync-50-Threads-IO-Bound-Work.jmx file within JMeter.
Start the test and observe the result. Below is what I get.
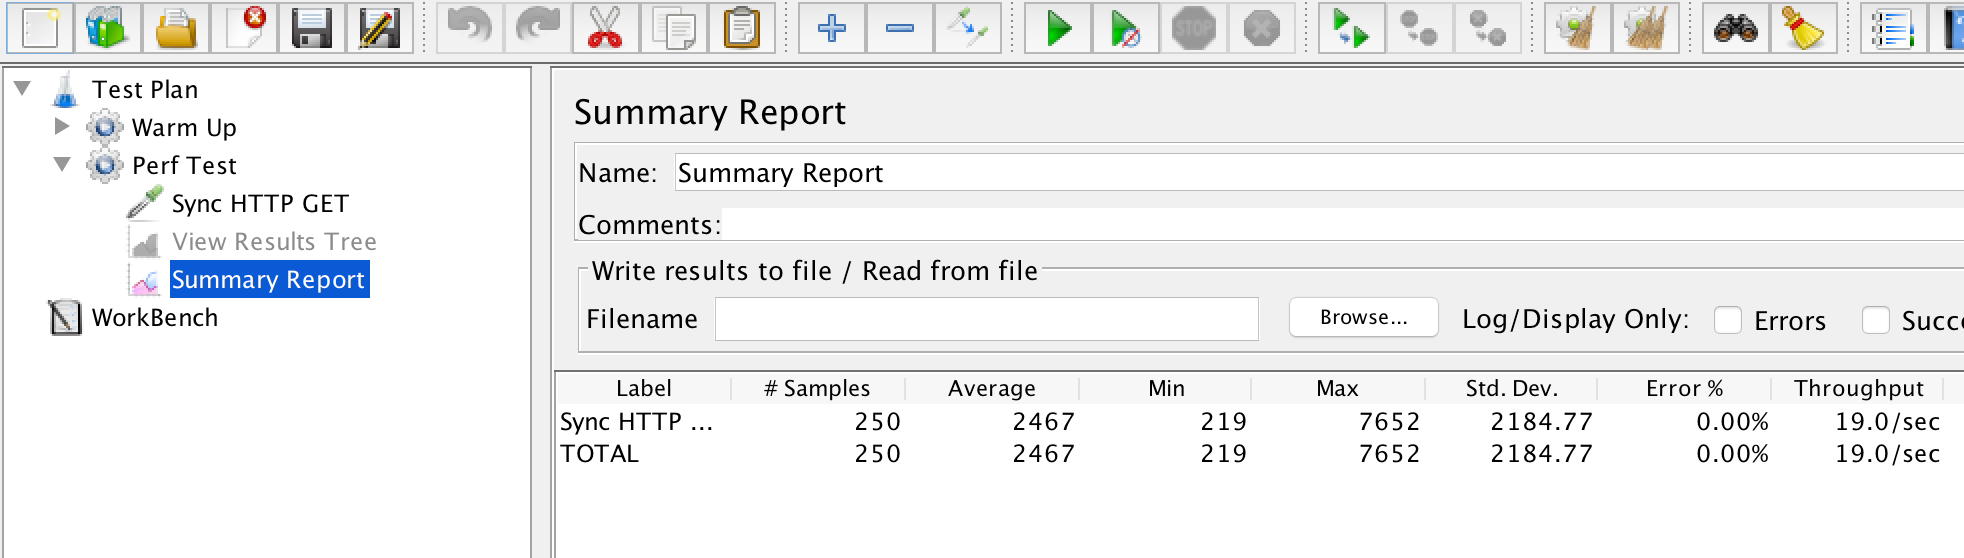
As you can see on average the sync action took 2467 milliseconds instead of 200-210 milliseconds we expected. We have hit a significant performance problem here. If you look into the terminal logs (where you started the app), you will see that the app had only 5 threads to respond to the requests but the number of requests were 50, it tried to increase the number of threads but it took the app 15 seconds to have 57 threads up from 5 threads. Given the fact that the sync actions blocks the threads on waits (sleep in this case), they could not be used in other requests although they are doing nothing but wait and new threads had to be created which required some time to catch up and the performance became very poor.
app_1    | At 10/29/2016 22:30:33 - # of threads in use is 5, avail worker: 400, ports: 400
app_1    | At 10/29/2016 22:30:34 - # of threads in use is 5, avail worker: 400, ports: 400
app_1    | At 10/29/2016 22:30:35 - # of threads in use is 5, avail worker: 400, ports: 400
app_1    | At 10/29/2016 22:30:36 - # of threads in use is 12, avail worker: 395, ports: 400
app_1    | At 10/29/2016 22:30:37 - # of threads in use is 17, avail worker: 390, ports: 400
app_1    | At 10/29/2016 22:30:38 - # of threads in use is 17, avail worker: 390, ports: 400
app_1    | At 10/29/2016 22:30:39 - # of threads in use is 17, avail worker: 390, ports: 400
app_1    | At 10/29/2016 22:30:40 - # of threads in use is 17, avail worker: 390, ports: 400
app_1    | At 10/29/2016 22:30:41 - # of threads in use is 17, avail worker: 390, ports: 400
app_1    | At 10/29/2016 22:30:42 - # of threads in use is 18, avail worker: 389, ports: 400
app_1    | At 10/29/2016 22:30:43 - # of threads in use is 20, avail worker: 387, ports: 400
app_1    | At 10/29/2016 22:30:44 - # of threads in use is 25, avail worker: 382, ports: 400
app_1    | At 10/29/2016 22:30:45 - # of threads in use is 27, avail worker: 380, ports: 400
app_1    | At 10/29/2016 22:30:46 - # of threads in use is 27, avail worker: 380, ports: 400
app_1    | At 10/29/2016 22:30:47 - # of threads in use is 37, avail worker: 370, ports: 400
app_1    | At 10/29/2016 22:30:48 - # of threads in use is 47, avail worker: 360, ports: 400
app_1    | At 10/29/2016 22:30:49 - # of threads in use is 57, avail worker: 350, ports: 400
app_1    | At 10/29/2016 22:30:50 - # of threads in use is 57, avail worker: 350, ports: 400
app_1    | At 10/29/2016 22:30:51 - # of threads in use is 57, avail worker: 350, ports: 400
Async action test
[HttpGet]
public async Task<IHttpActionResult> AsyncGet200MsDelay()
{
    // simulate a delay - could be a database query or another service request
    await Task.Delay(200);

    return await Task.FromResult(Ok(GetSampleCustomers()));
}
Let us this time test the async action in the I/O bound case namely, AsyncGet200MsDelay action. JMeter thread group will again give 50 concurrent requests and all will make 5 loops. The acceptable response time is again will be around 200-210 milliseconds. Let us if we will reach it with async actions.
Run make restart-app command, run JMeter and open the file JMeter/Async-50-Threads-IO-Bound-Work.jmx file within JMeter.
Start the test and observe the result. Below is what I get.
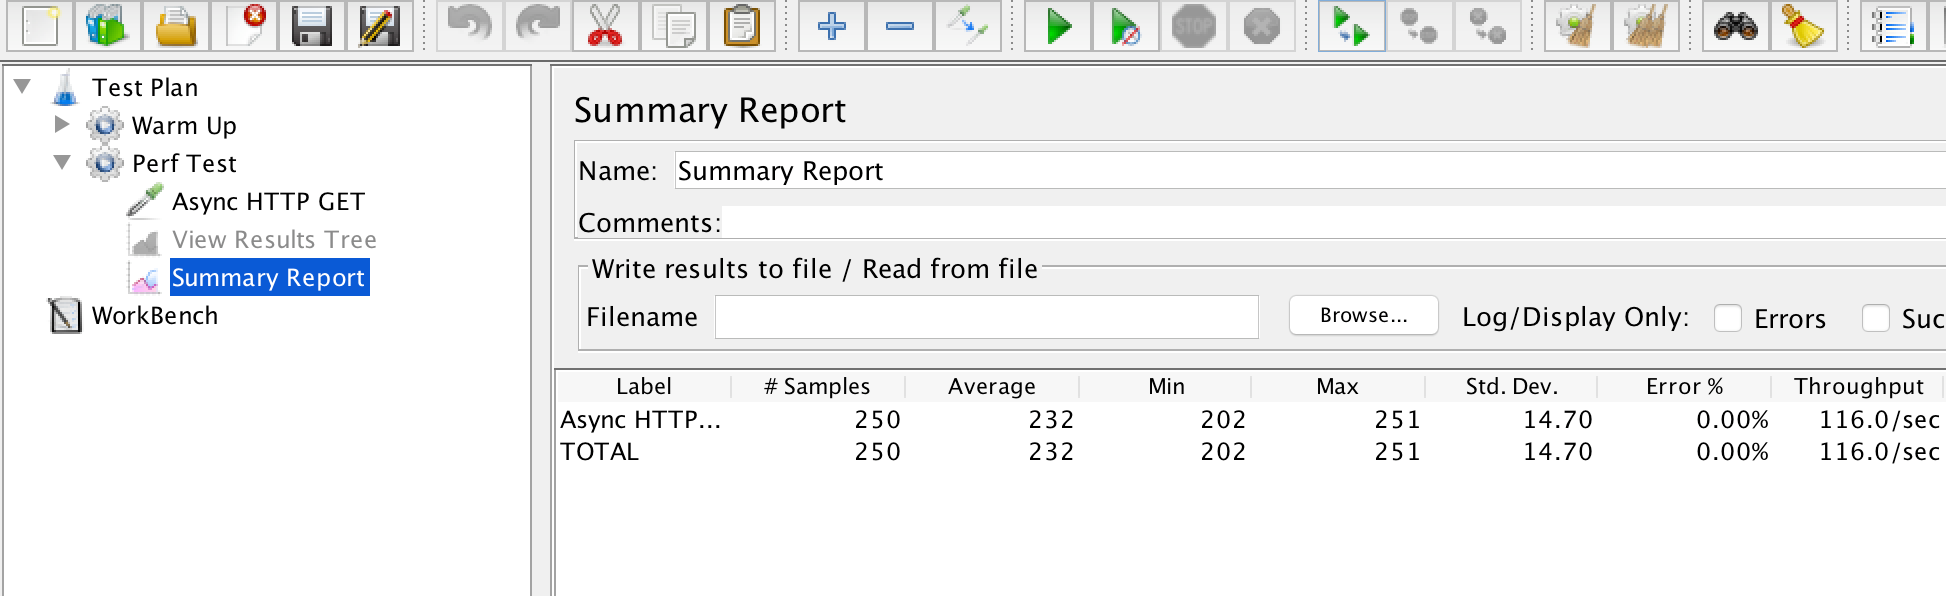
As you can see on average the async action took 232 milliseconds instead of 200-210 milliseconds we expected but this is acceptable. The threads waiting could be used to fulfill other requests and we were able to achieve this result so we prove the assertion given above async actions helped application to scale very well. Looking at the terminal logs (where you started the app), you will see that the app had 6 threads to respond to the requests then it increased the number of threads to 13 to better performance.
app_1    | At 10/29/2016 22:42:51 - # of threads in use is 6, avail worker: 400, ports: 400
app_1    | At 10/29/2016 22:42:52 - # of threads in use is 6, avail worker: 400, ports: 400
app_1    | At 10/29/2016 22:42:53 - # of threads in use is 6, avail worker: 400, ports: 400
app_1    | At 10/29/2016 22:42:54 - # of threads in use is 10, avail worker: 397, ports: 400
app_1    | At 10/29/2016 22:42:55 - # of threads in use is 13, avail worker: 394, ports: 400
app_1    | At 10/29/2016 22:42:56 - # of threads in use is 13, avail worker: 394, ports: 400
app_1    | At 10/29/2016 22:42:57 - # of threads in use is 13, avail worker: 394, ports: 400
app_1    | At 10/29/2016 22:42:58 - # of threads in use is 13, avail worker: 394, ports: 400
app_1    | At 10/29/2016 22:42:59 - # of threads in use is 13, avail worker: 394, ports: 400
app_1    | At 10/29/2016 22:43:00 - # of threads in use is 13, avail worker: 394, ports: 400
app_1    | At 10/29/2016 22:43:01 - # of threads in use is 13, avail worker: 394, ports: 400
app_1    | At 10/29/2016 22:43:02 - # of threads in use is 13, avail worker: 394, ports: 400
Sync / Async Comparison in CPU Bound Application
Other actions the Customers controller has are SyncGetCpuBound and AsyncGetCpuBound actions which are making a calculations for some time and returning the number computed. Again one is doing it synchronously and one is asynchronously.
Sync action test
[HttpGet]
public IHttpActionResult SyncGetCpuBound()
{
    var result = HeavyWork();

    return Ok(result);
}
In the CPU bound case namely, let us test SyncGetCpuBound action first. JMeter thread group will give 50 concurrent requests and all will make 5 loops.
Run make restart-app command, run JMeter and open the file JMeter/Sync-50-Threads-CPU-Bound-Work.jmx file within JMeter.
Start the test and observe the result. Below is what I get.
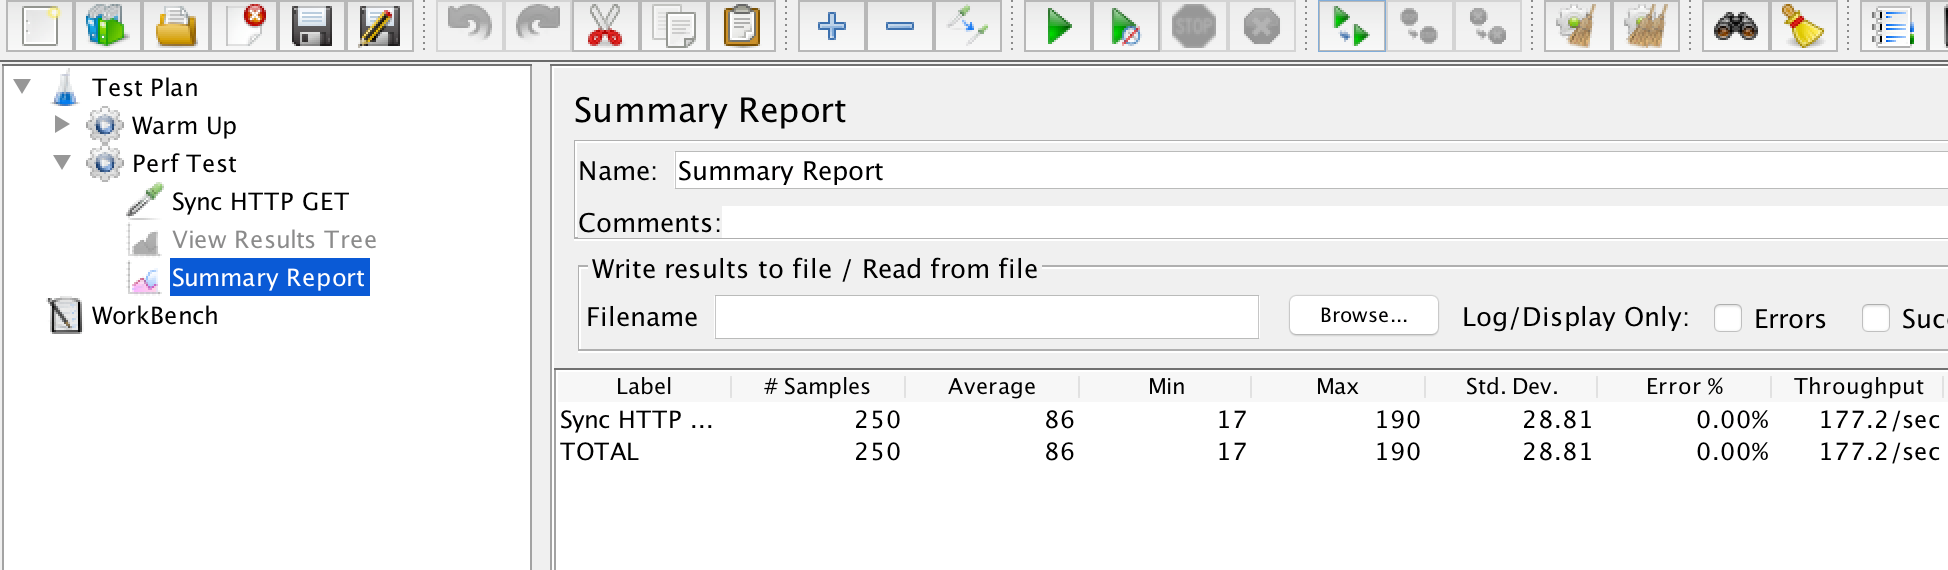
As you can see on average the sync action took 86 milliseconds. It is hard to tell whether this result is better than the async case without testing it too. The assertion was that sync actions will not be worse than the async actions. Let us test async case then comment on it.
Async action test
[HttpGet]
public async Task<IHttpActionResult> AsyncGetCpuBound()
{
    var result = HeavyWork();

    return await Task.FromResult(Ok(result));
}
In the CPU bound case namely, let us test AsyncGetCpuBound action now. JMeter thread group will give 50 concurrent requests and all will make 5 loops.
Run make restart-app command, run JMeter and open the file JMeter/Async-50-Threads-CPU-Bound-Work.jmx file within JMeter.
Start the test and observe the result. Below is what I get.
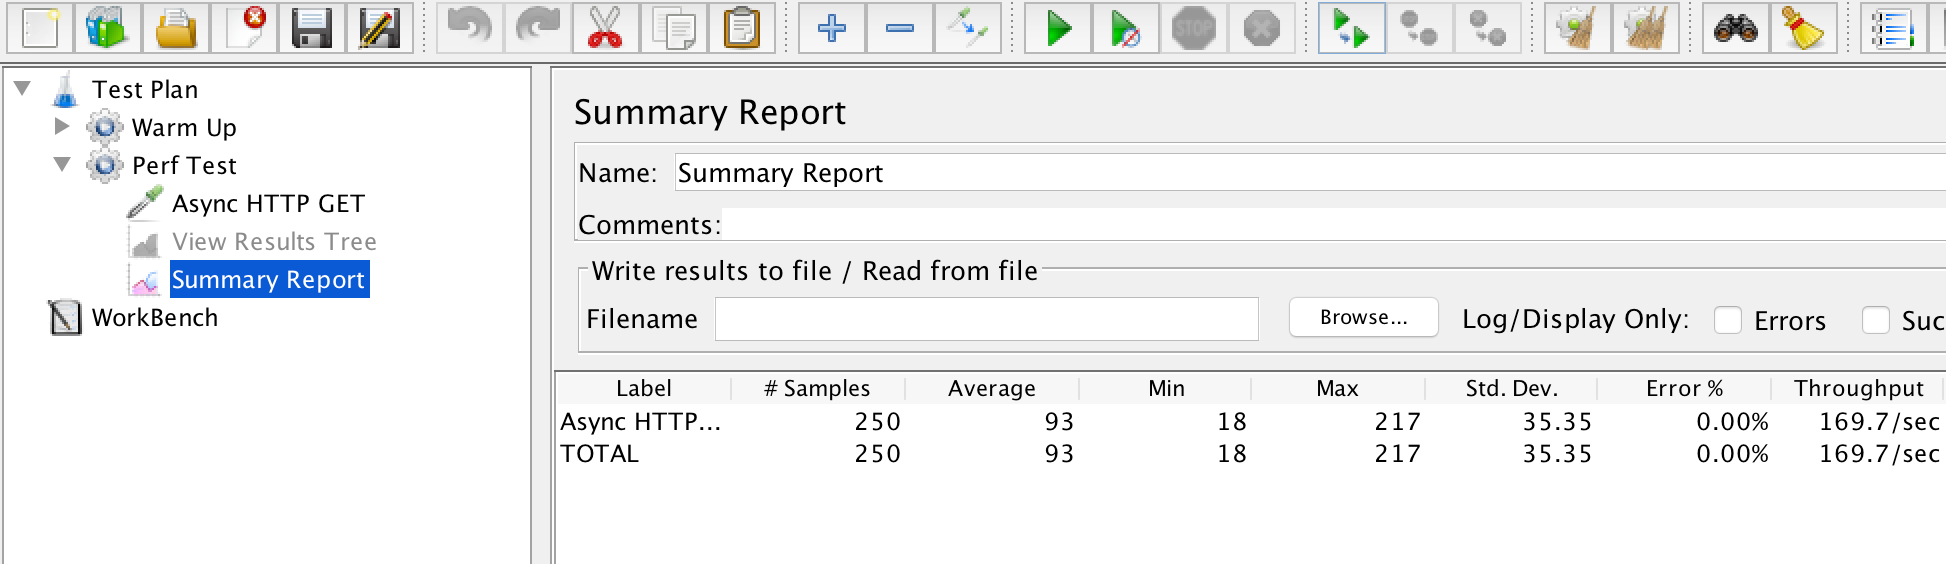
As you can see on average the async action took 93 milliseconds. It got worse in async case this time, I bet you were not expecting this much.
The assertion in CPU bound case is also proven. In the CPU bound apps, async pipeline does not increase the scalability of the app and therefore increase the performance.
Conclusion
It should be clear now that async actions are not secret weapons improving overall scalability and performance of an application magically. They are able to scale I/O bound applications so that they can better utilize the resources. However async actions do not come with zero cost, writing async code requires more care, proficiency and it has its own challenges.
I hope you enjoyed as much as I enjoyed writing all these. Waiting for the comments and corrections if any.